> For the complete documentation index, see [llms.txt](https://help.citrusad.com/retail-media-interface/llms.txt). Markdown versions of documentation pages are available by appending `.md` to page URLs; this page is available as [Markdown](https://help.citrusad.com/retail-media-interface/retailer-reporting/inventory-yield-report.md).
# Inventory yield report
The Inventory Yield Report shows how your ad placements are performing. It displays ad requests and fill rate, revenue, impressions and eCPM, and where targeting demand concentrates, so you can spot under-filled placements and yield opportunities without building a report.
{% hint style="warning" %}
## Staged rollout
This report is progressively rolling out to retailers. If you'd like to be one of the first to try it, reach out to your account manager.
{% endhint %}
### Overview
The Inventory Yield Report brings placement-level performance together in one view: a performance table, a trend chart over time, the split between auction and Featured/Targeted Auction demand, your active and scheduled Featured/Targeted Auction campaigns, and targeting opportunities by display category. Use it to understand fill rate, revenue, and demand across your inventory, and to decide where to act.
### Why use this feature?
* **See placement yield at a glance:** Fill rate, ad requests and ads served, revenue, impressions, and eCPM per placement.
* **Track performance over time:** A trend chart shows how placement metrics move across your selected date range.
* **Understand your revenue mix:** See how revenue and share split between auction and Featured/Targeted Auction demand.
* **Find targeting demand:** See where targeting demand concentrates by display category.
#### How to access the Inventory Yield Report
As a retailer, you'll find this under the Insights tab. Select **Inventory Yield Report** from the sidebar.
{% hint style="info" %}
**Don't see the report?**
Check that you're in the retailer team, and that the report is rolled out to your account.
{% endhint %}
### Key Information
#### Page filters
| Filter | Description |
| -------------- | ---------------------------------------------------------------- |
| **Catalog** | Select the retailer catalog to scope performance to. |
| **Date Range** | The date range used to filter every table and chart on the page. |
#### Placement performance chart (Trend over time)
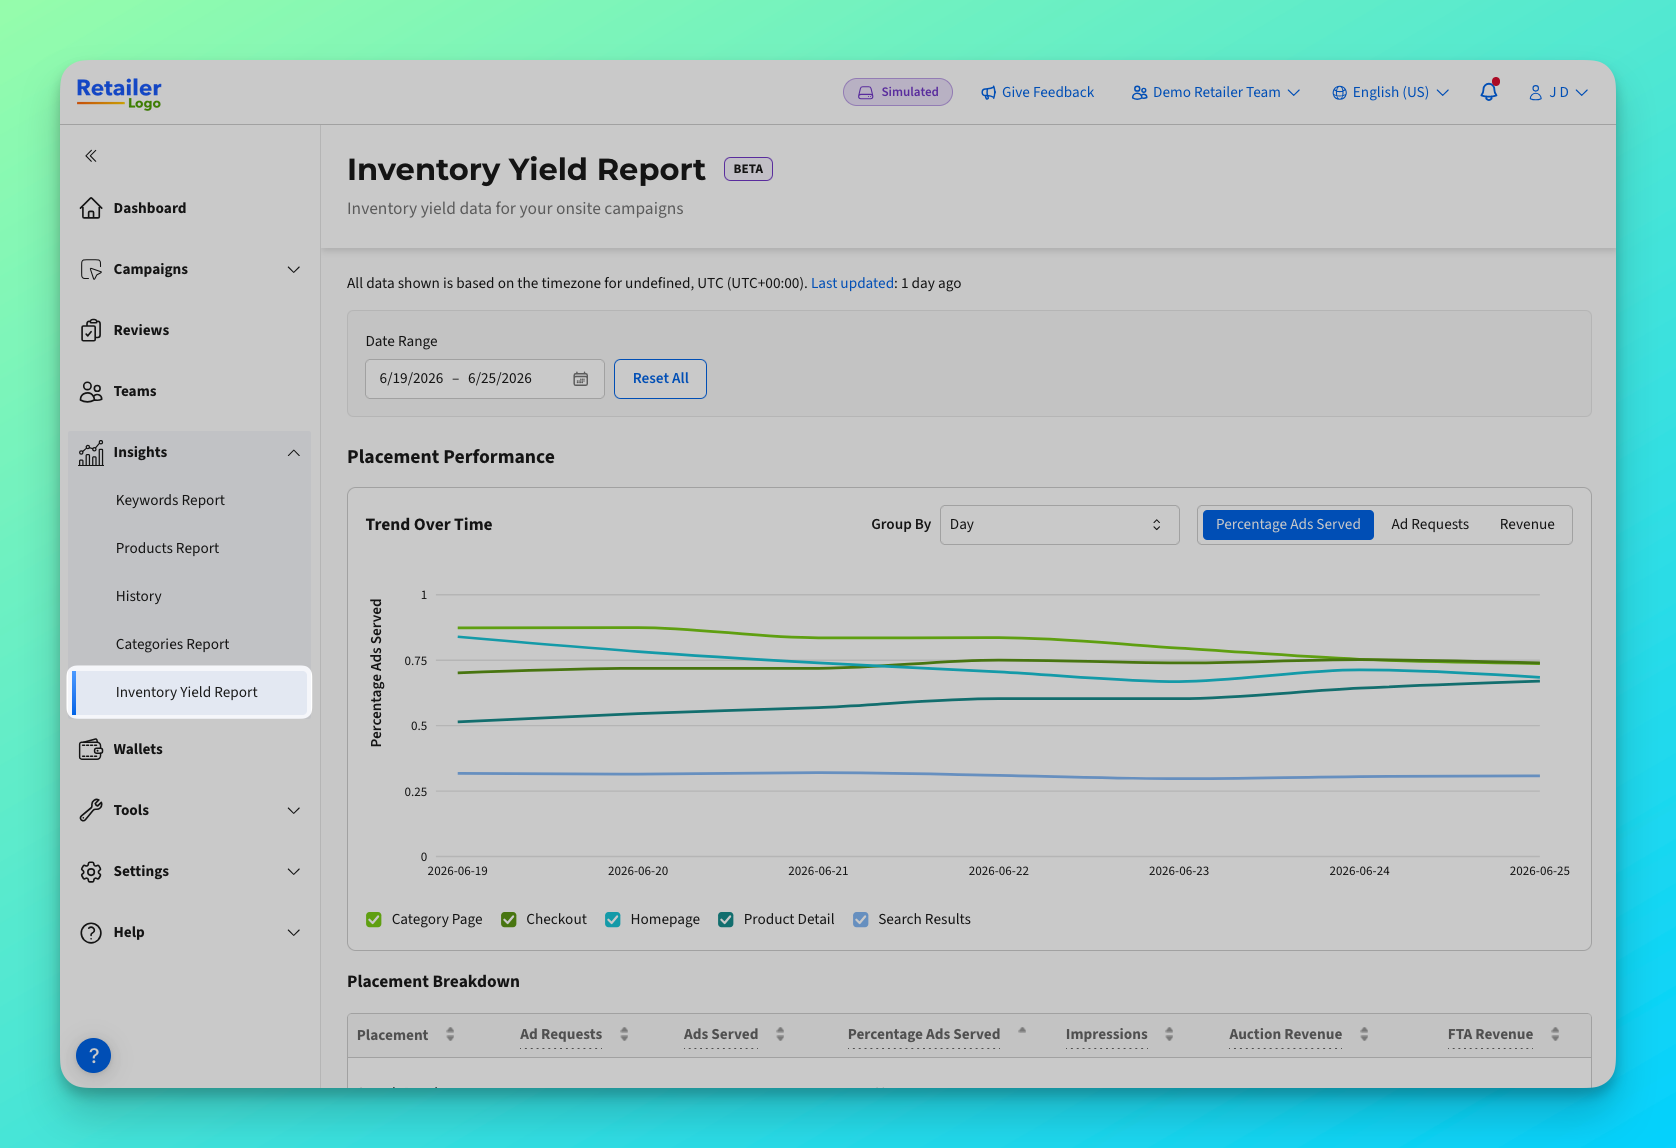
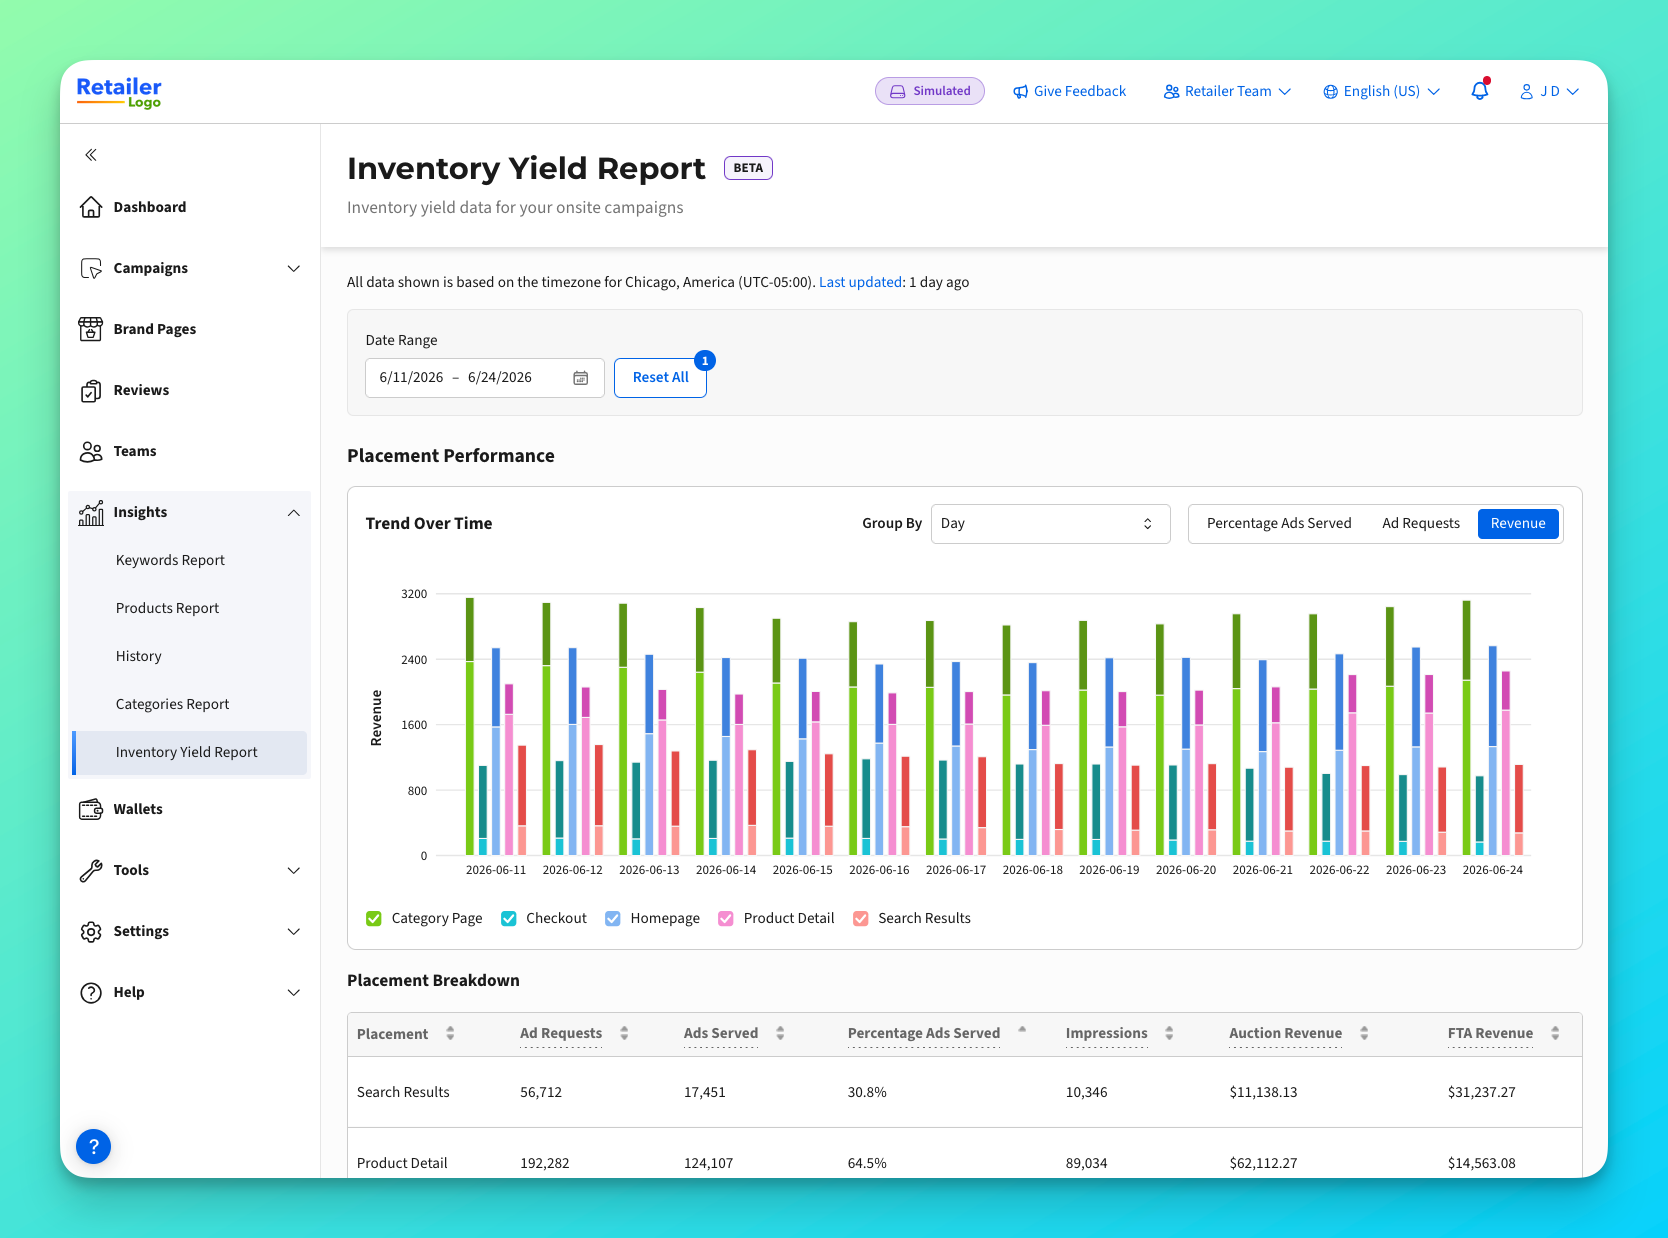
At the top of the **Placement performance** section is the **Trend over time** chart. It plots each placement currently in scope as its own series across your selected date range, so you can see whether a placement is climbing, holding steady, or declining instead of relying on a single snapshot. The chart has two controls — a **Group by** dropdown and a metric toggle — and the chart type (lines or stacked bars) changes depending on the metric you choose.
**Metric options**
The metric toggle has three options. The first two draw a **line per placement**; the third draws a **stacked bar per placement**.
| Option | Chart type | What it plots |
| ----------------------------------- | ----------- | ------------------------------------------------------------------------------------------------------------------------------------------------------------------------------------------------------------------------------------------------------------------------------------------------------------------------------------------------------------------------------------------------------ |
| **Percentage ads served** (default) | Line | Fill rate for each placement over time — the share of ad requests that were served, shown as a percentage. This is the default view and the quickest way to spot under-filled placements trending up or down. |
| **Ad requests** | Line | The number of ad requests received for each placement over time, shown as whole numbers. Use it to see demand volume and seasonality per placement. |
| **Revenue** | Stacked bar | Revenue for each placement over time, shown in your catalogue currency. Each placement's bar is stacked from two segments — **Auction revenue** and **FTA Revenue** — so you can see both total revenue and the auction-vs-FTA split in one bar. The **FTA Revenue** segment appears only when Featured/Targeted Auction is configured for your catalog; otherwise the bar shows auction revenue only. |
#### Placement Breakdown table
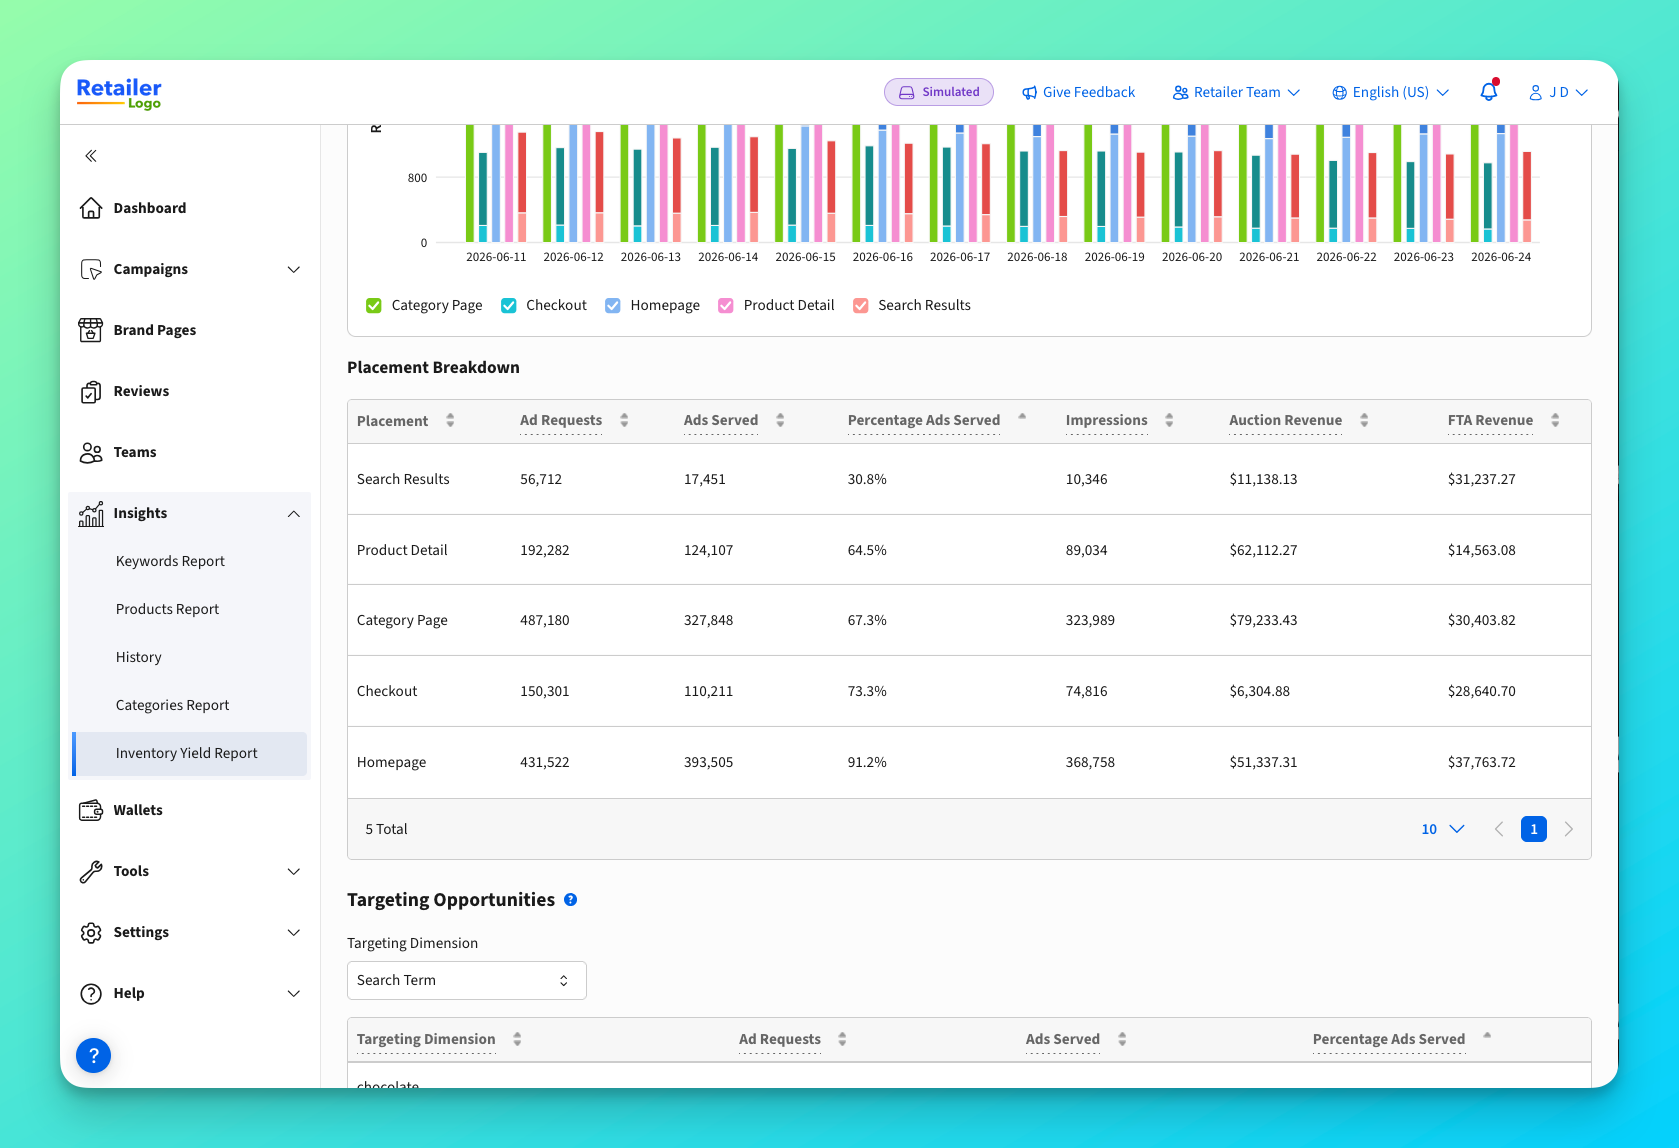
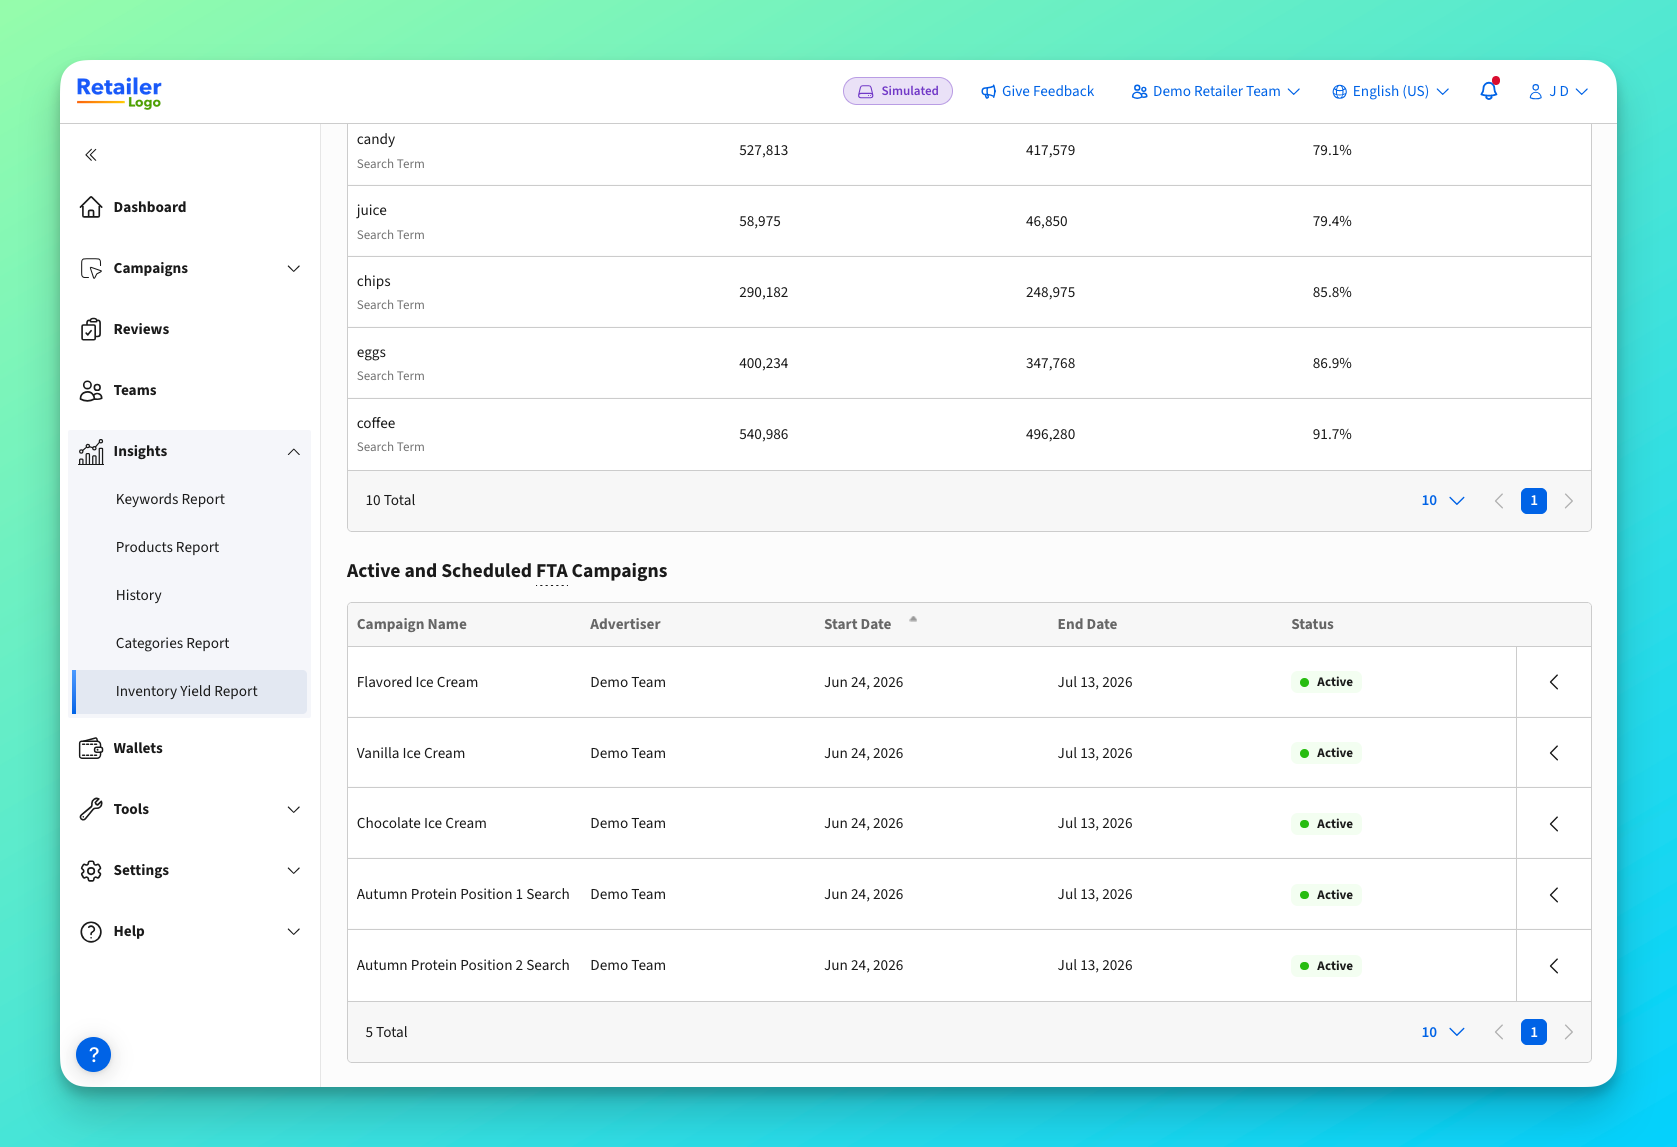
The main table breaks down yield for each ad placement so you can compare fill rate, revenue, and efficiency side by side. Use it to find placements that are under-filled or earning a low eCPM, then dig into the trend chart to see whether they are improving or declining.
| Metric | Description |
| ------------------------- | --------------------------------------------------------------------------------------------------------------------------------------------------------------------------------------------------------------------- |
| **Placement** | The ad placement the row reports on. |
| **Ad requests** | Total number of ad requests received for the placement in the selected date range. |
| **Ads served** | Total number of ads served for the placement in the selected date range. |
| **Percentage Ads Served** | The share of ad requests that were served (ads served ÷ ad requests) as a percentage. A low fill rate can indicate unsold inventory, eligibility/targeting limits, or integration inefficiencies worth investigating. |
| **Impressions** | Total impressions delivered for the placement. |
| **Auction revenue** | Revenue from auction demand for the placement, in catalogue currency. |
| **FTA Revenue** | Revenue from fixed tenancy campaigns for the placement, in catalogue currency. |
| **eCPM** | Effective cost per mille — revenue earned per thousand impressions. Use it to compare how efficiently each placement monetises. |
| **FTA share** | The share of the placement's demand attributable to fixed tenancy campaigns/Targeted Auction. |
#### Targeting Opportunities
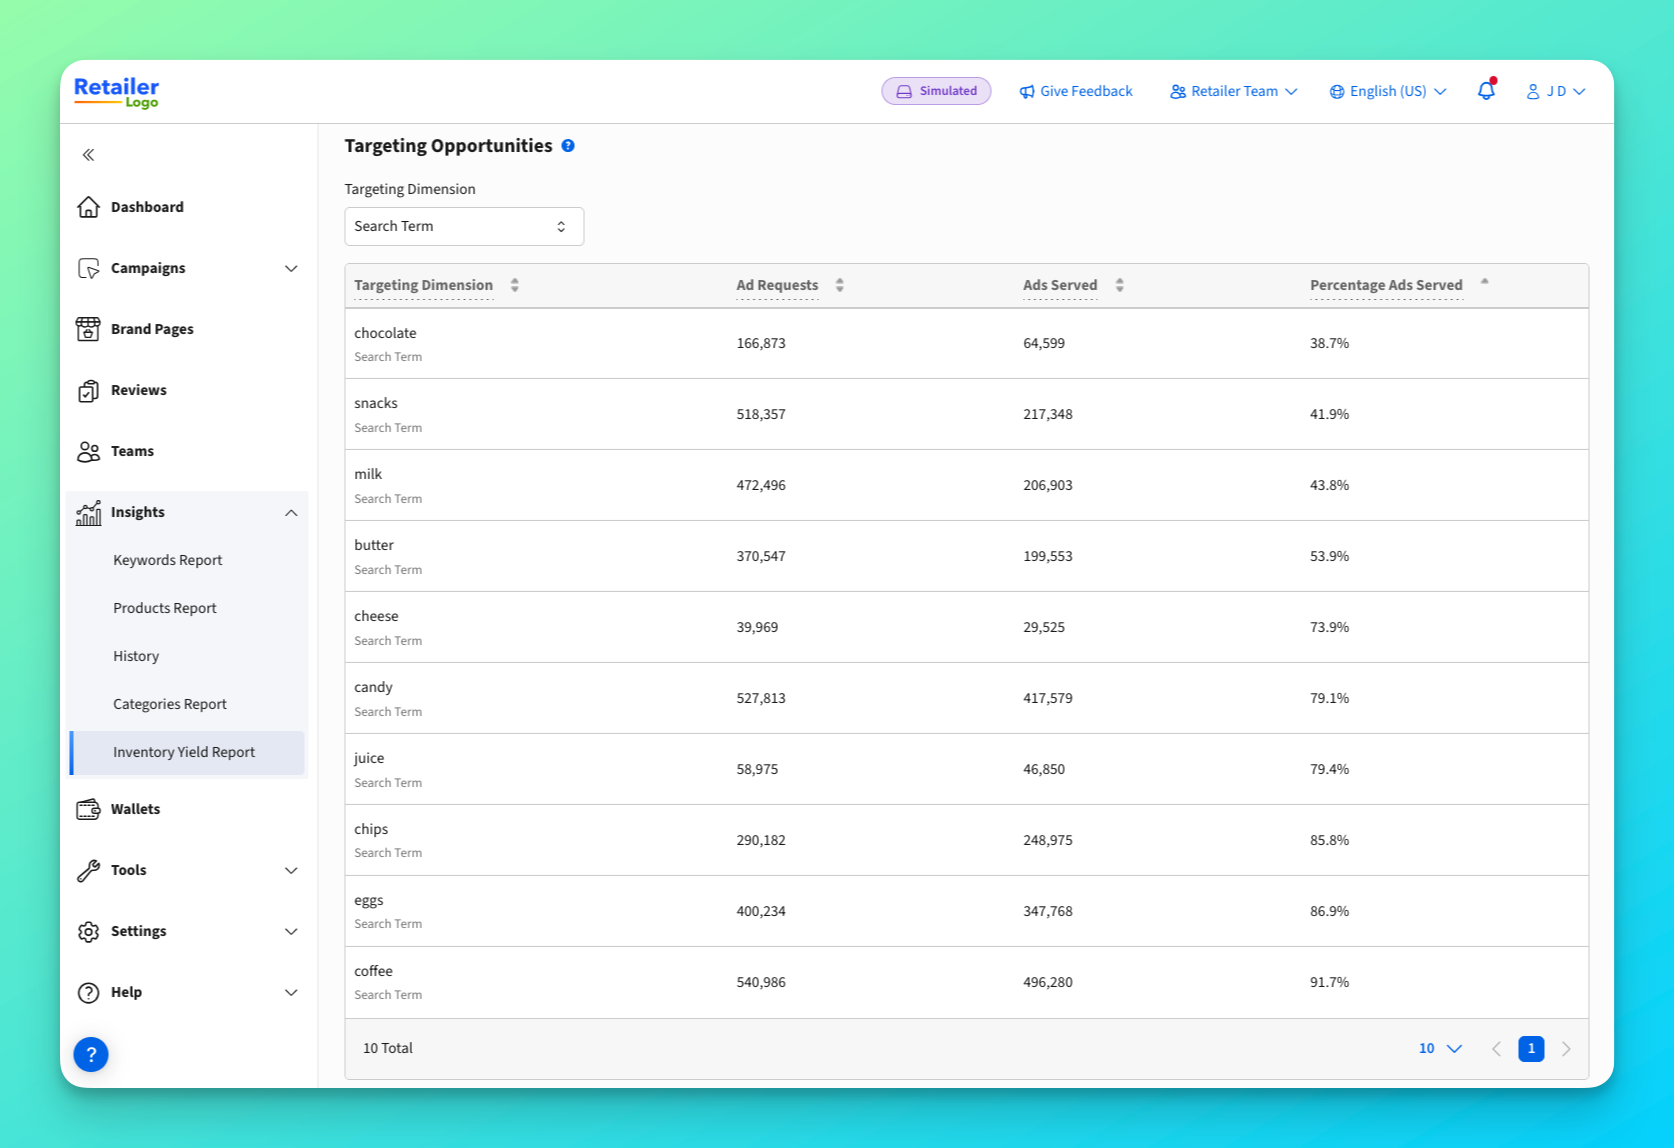
This table shows where targeting demand concentrates by display category, comparing ad requests against ads served. Categories with high requests but low fill are opportunities to capture more demand.
| Metric | Description |
| ----------------------- | -------------------------------------------------------------------------------------------------------------------------- |
| **Targeting Dimension** | The targeting dimension value the row reports on (for example, a display category). |
| **Ad requests** | Ad requests attributed to the dimension in the selected date range. |
| **Ads served** | Ads served for the category in the selected date range. |
| **Fill rate** | The share of the category's ad requests that were served. A high request volume with a low fill rate signals unmet demand. |
#### Active and Scheduled FTA campaigns
A table of your active and scheduled FTA (Fixed Tenancy Auction) campaigns, so you can see what is driving FTA demand during the selected period. This section is hidden when Featured/Targeted Auction is not configured for your catalogue.
| Column | Description |
| ----------------- | -------------------------------------------- |
| **Campaign name** | The name of the FTA campaign. |
| **Advertiser** | The name of the advertiser team. |
| **Start date** | When the campaign starts. |
| **End date** | When the campaign ends. |
| **Status** | Whether the campaign is active or scheduled. |
### Tips for success
* Set the date first — they scope every table and chart on the page.
* Use the placement table to find low-fill or low-eCPM placements, then check the trend chart to see whether they are improving or declining.
* If Featured/Targeted Auction is configured, compare auction and Featured/Targeted Auction revenue to understand your demand mix.
* If a number looks different from another report, check the date range and catalogue filter match.
### Troubleshooting & support
* **Numbers differ from another report:** Confirm the date range and catalogue filter match the other report.
* **Featured/Targeted Auction sections are missing:** They appear only when Featured/Targeted Auction is configured for your catalogue.
* **A placement shows zero served or low fill rate:** This reflects the underlying data for the selected period; investigate placement eligibility or demand.
* Still need help? Contact your account manager or
---
# Agent Instructions
This documentation is published with GitBook. GitBook is the documentation platform designed so that both humans and AI agents can read, navigate, and reason over technical content effectively. Learn more at gitbook.com.
## Querying This Documentation
If you need additional information that is not directly available in this page, you can query the documentation dynamically by asking a question.
Perform an HTTP GET request on the current page URL with the `ask` query parameter, and the optional `goal` query parameter:
```
GET https://help.citrusad.com/retail-media-interface/retailer-reporting/inventory-yield-report.md?ask=&goal=
```
`ask` is the immediate question: it should be specific, self-contained, and written in natural language.
`goal` is optional and describes the broader end goal you are ultimately trying to accomplish on behalf of the user. GitBook uses it to tailor the answer towards what is most useful for that goal.
The response will contain a direct answer to the question and relevant excerpts and sources from the documentation.
Use this mechanism when the answer is not explicitly present in the current page, you need clarification or additional context, or you want to retrieve related documentation sections.