> For the complete documentation index, see [llms.txt](https://help.citrusad.com/retail-media-interface/llms.txt). Markdown versions of documentation pages are available by appending `.md` to page URLs; this page is available as [Markdown](https://help.citrusad.com/retail-media-interface/advertiser-reporting/campaign-level-reporting.md).
# Campaign-level reporting
Campaign reporting has been streamlined in the new interface, with key functions enhanced for improved usability.
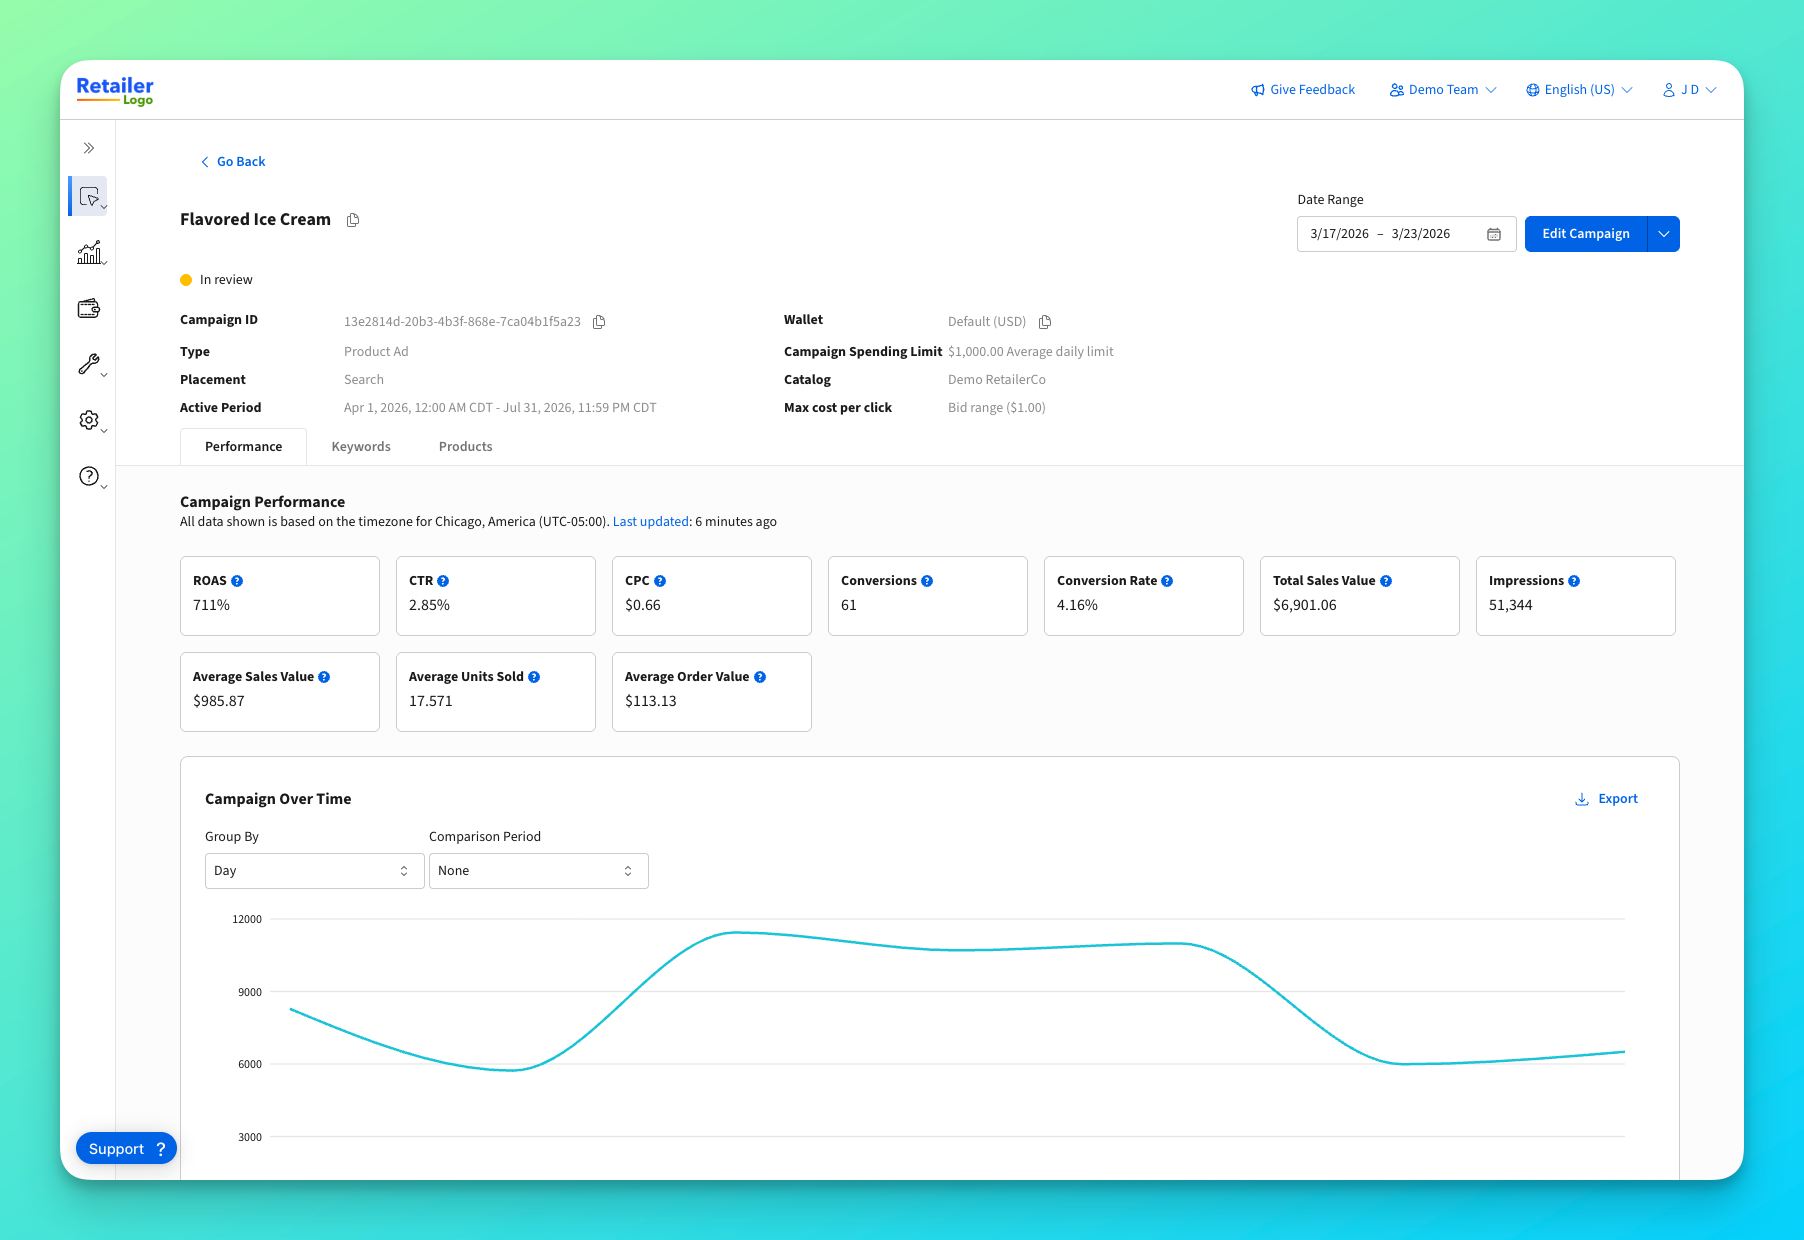
The redesigned Campaign Report page offers a comprehensive performance overview, including keyword and product breakdowns, along with key campaign details like status, budget, and settings. Users can customize date and breakdown ranges, and manage the campaign by editing, pausing, or duplicating it directly from the page.
{% hint style="info" %}
## Both retailers and advertisers can access campaign-level reporting
{% endhint %}
#### **How to View the Campaign Level Report:**
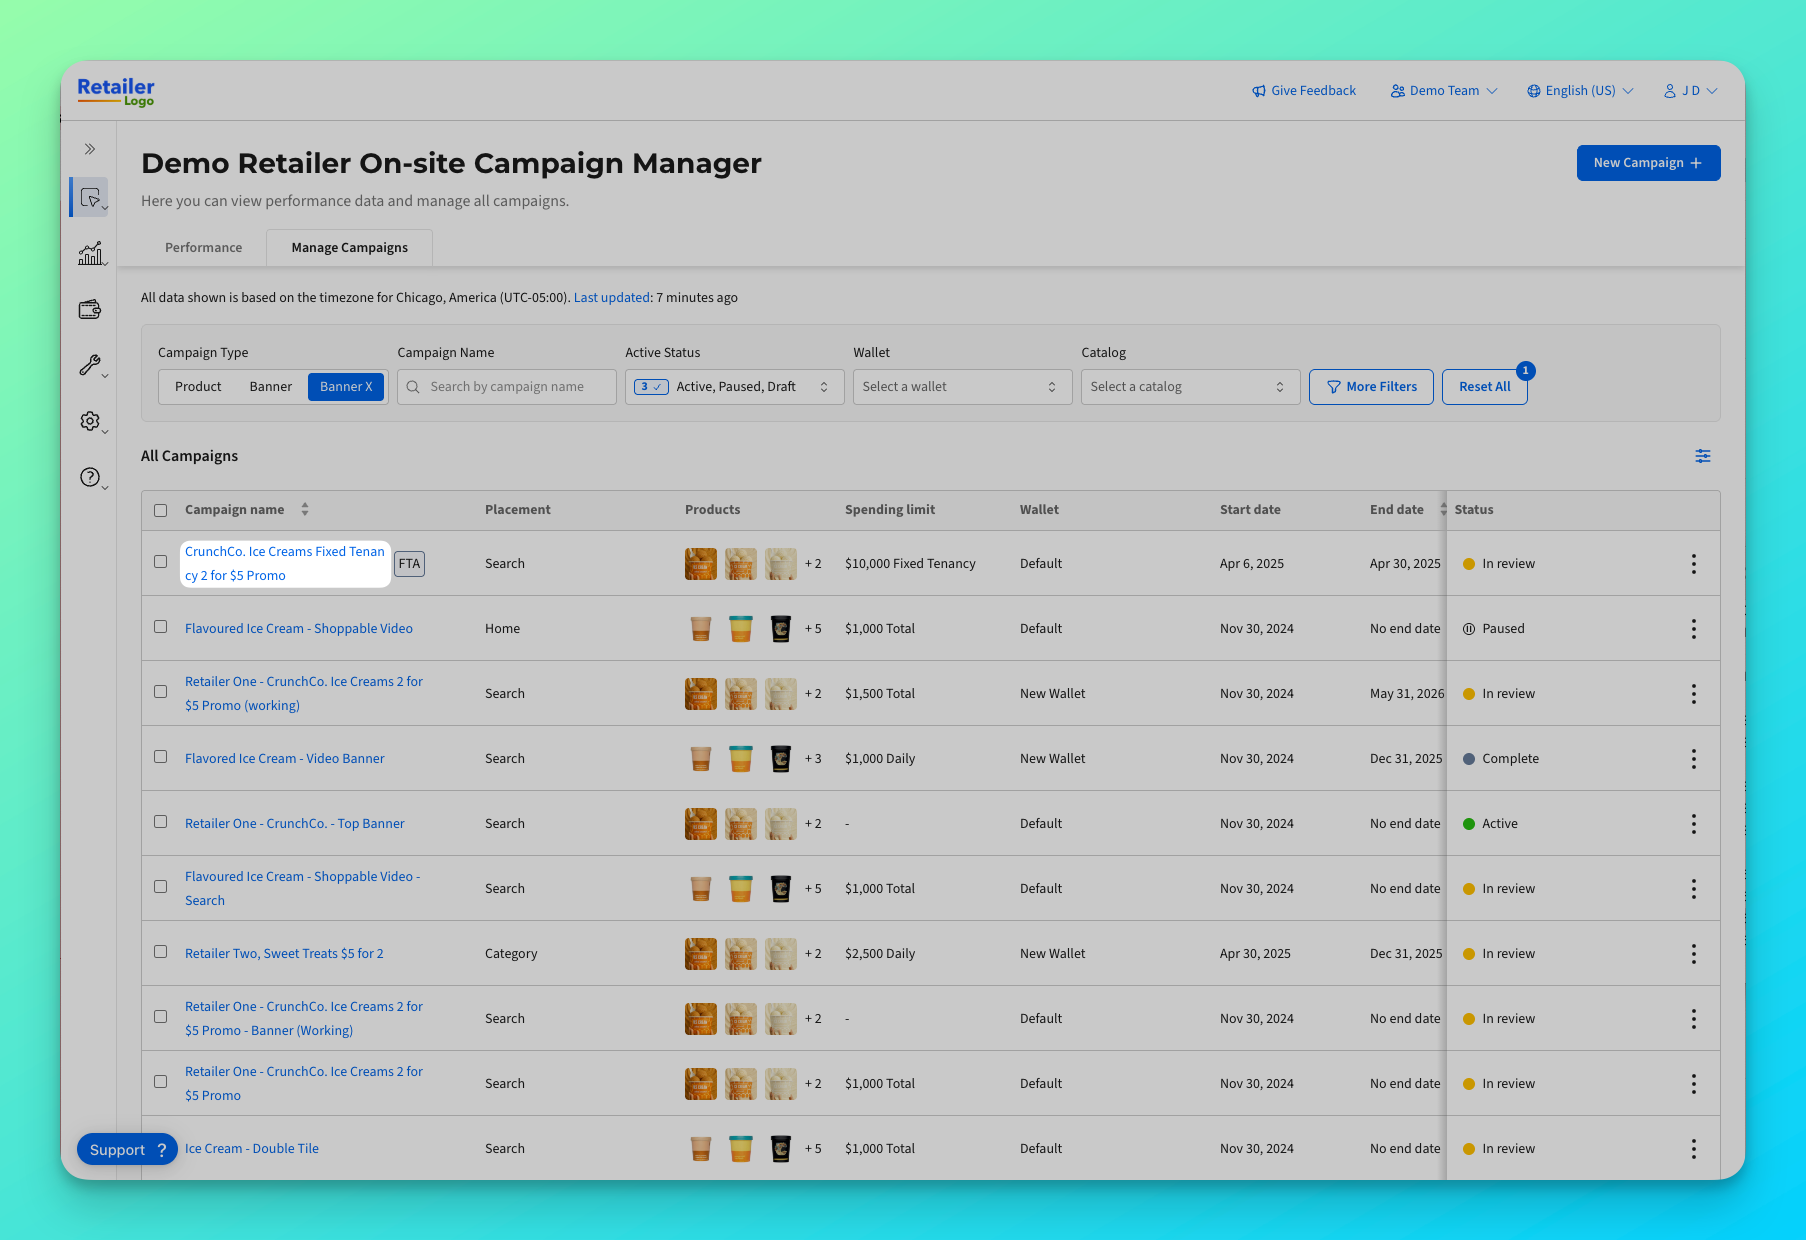
1. Navigate to the campaign management dashboard.
2. Filter to the campaign you want to view.
3. Click the campaign name.
It's that easy! You can also click the campaign's name on the performance dashboard to go to the campaign-level report.
***
### Understanding the campaign header
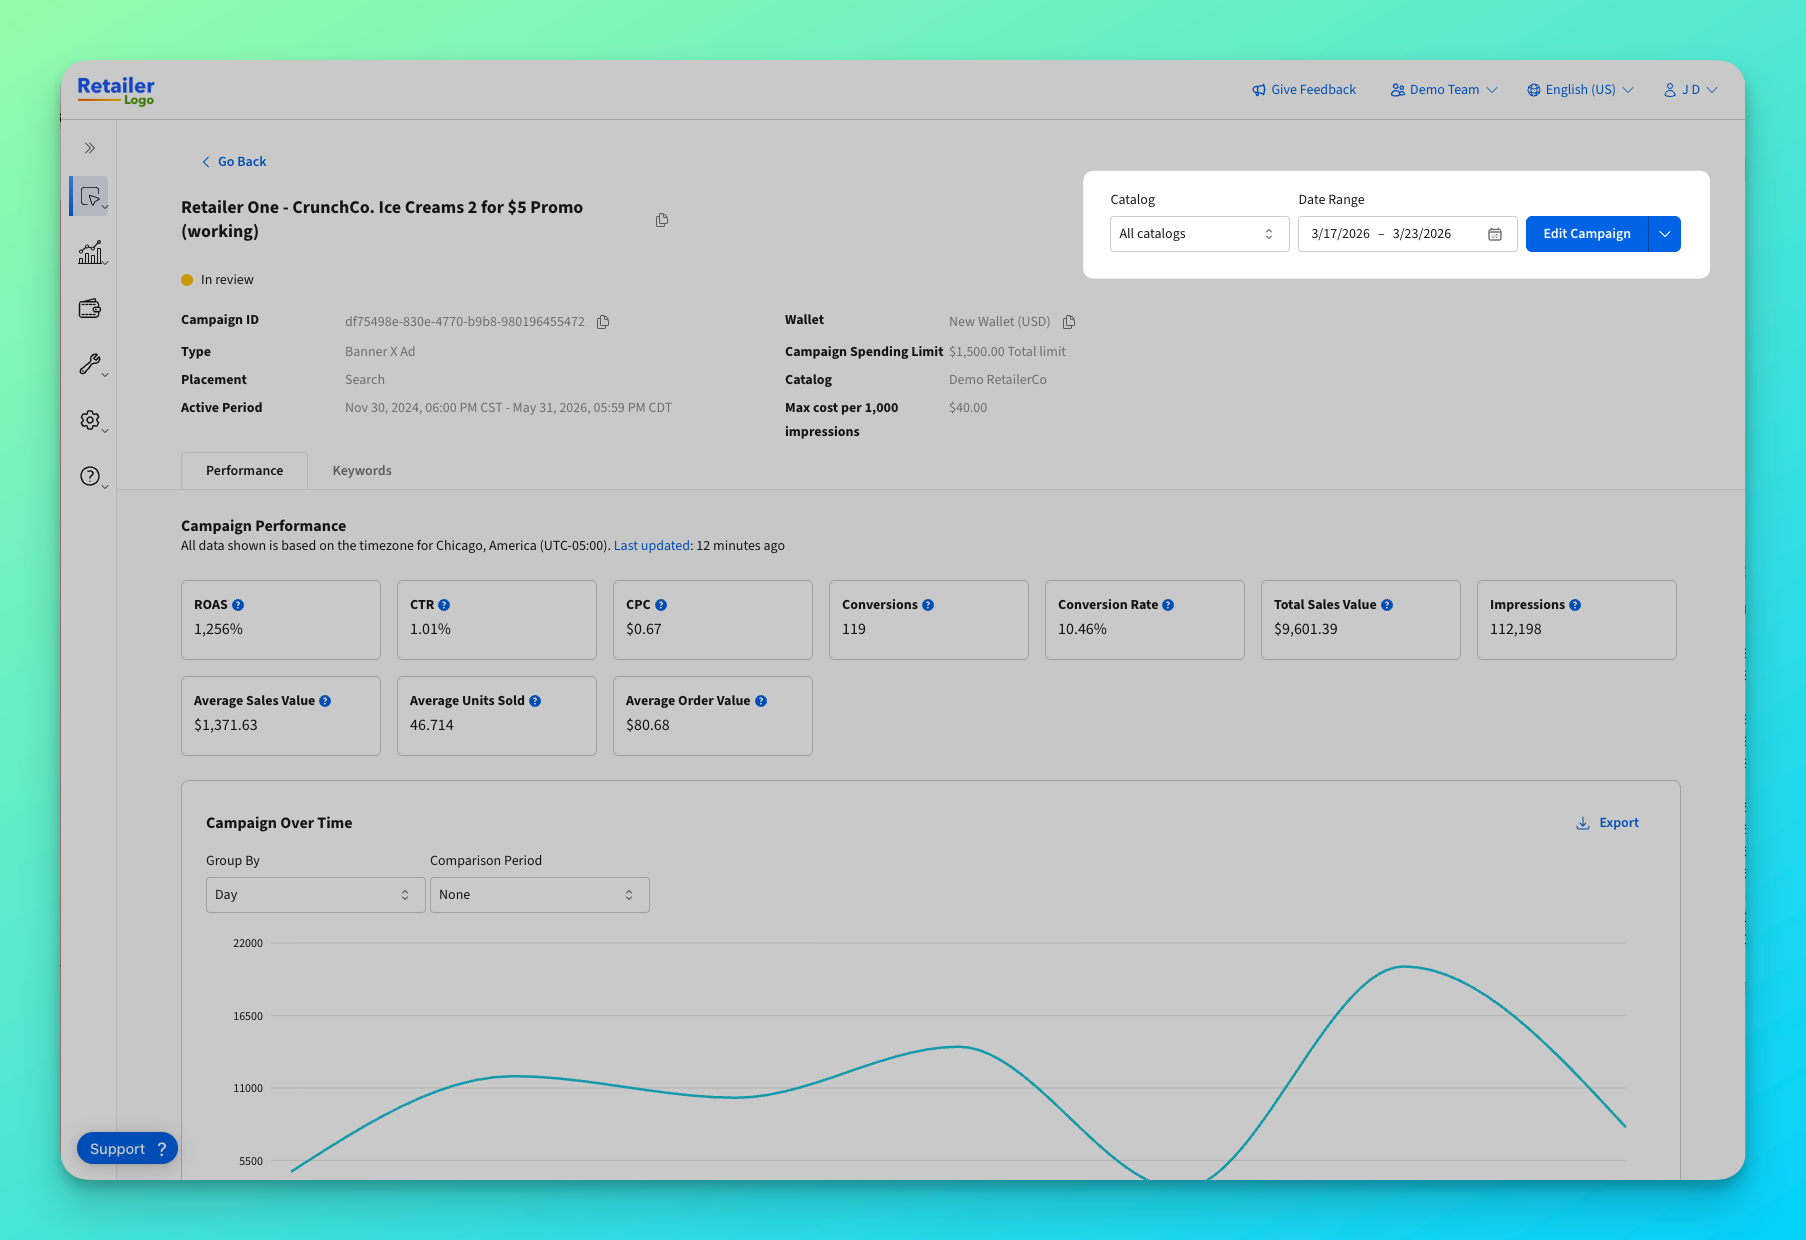
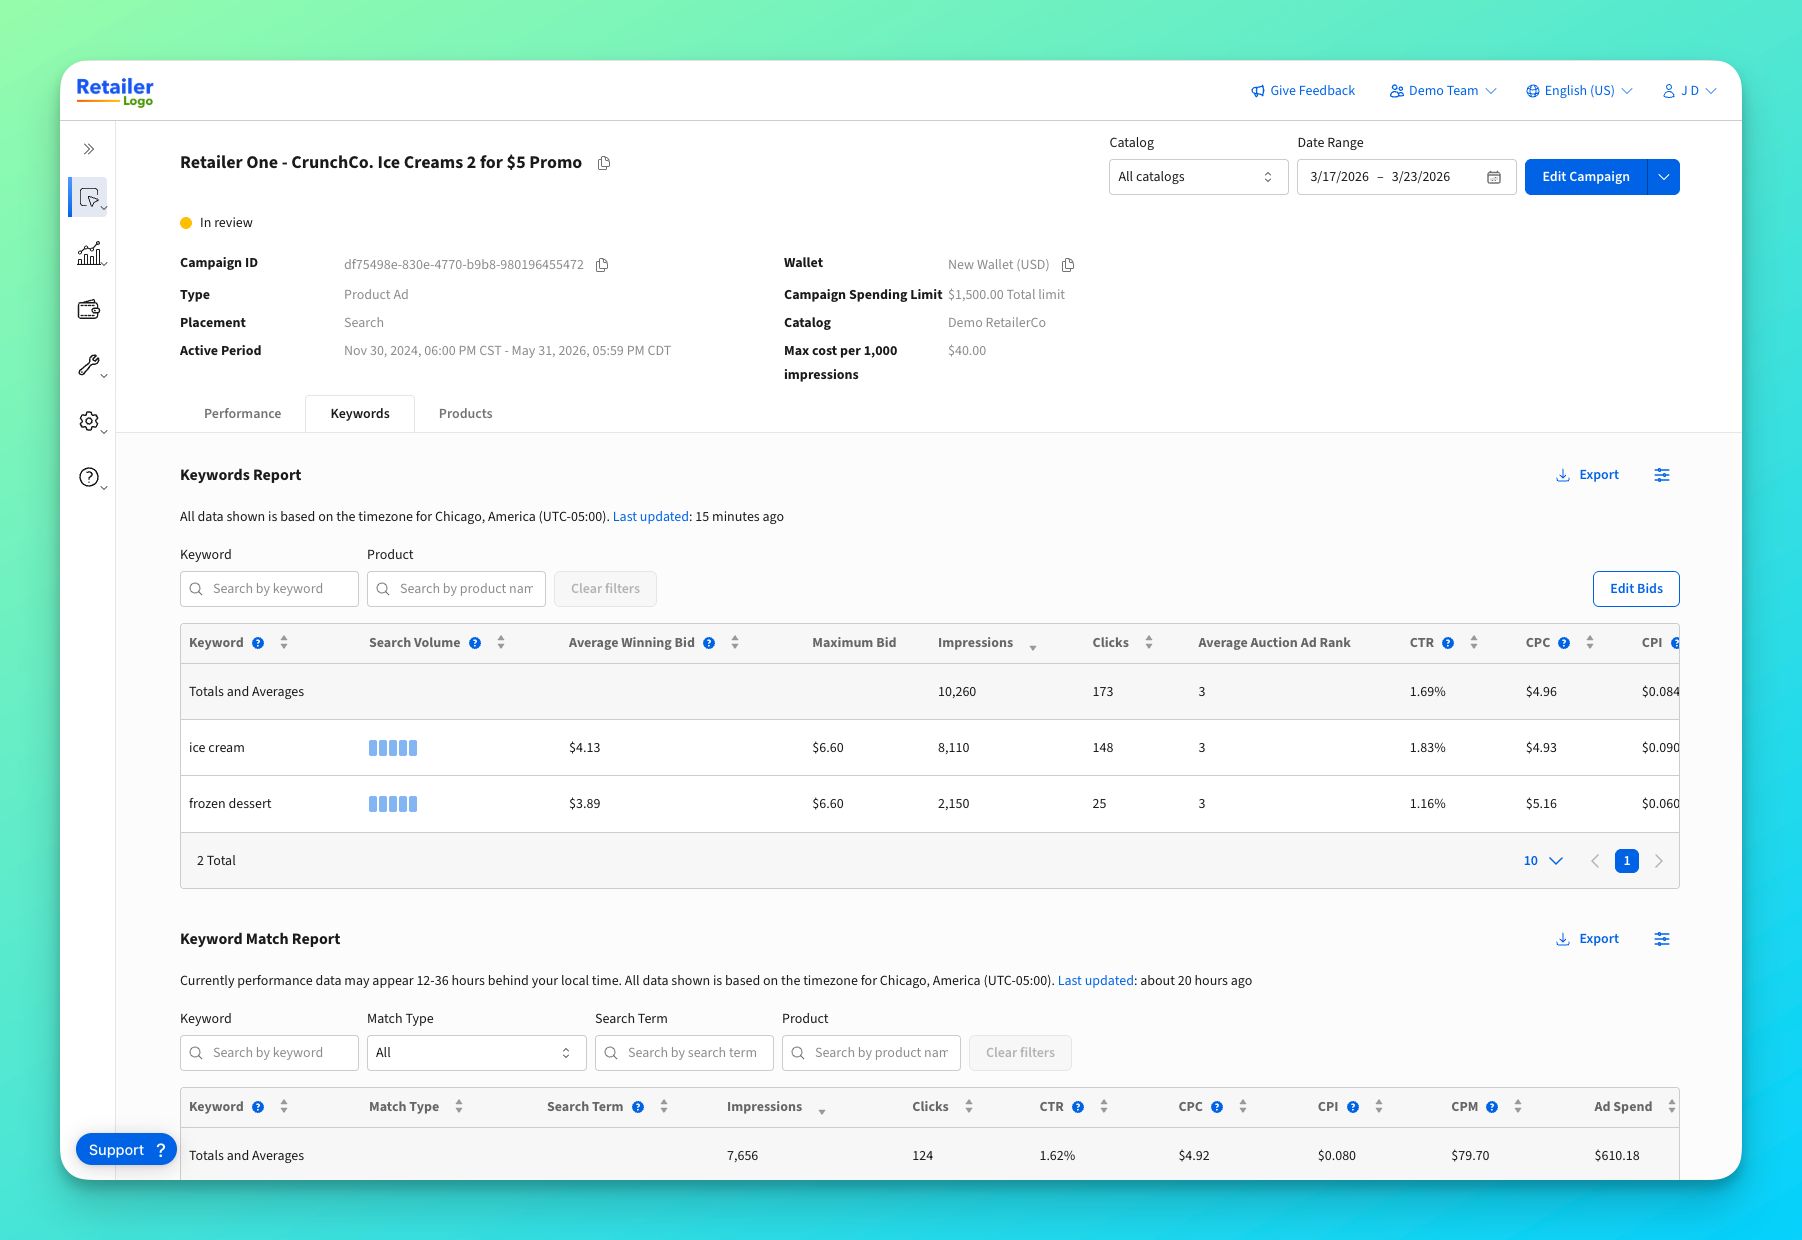
At the top of the page, you'll see key details about your campaign:
* **Campaign name** and status
* **Campaign ID:** click the copy icon to copy it
* **Type:** Product Ad, Banner, Banner X, or Brand Page
* **Placement:** where the ads appear
* **Active period:** start and end dates
* **Wallet:** funding source with currency
* **Spending limit:** budget cap for the campaign
* **Catalog**: product catalog(s) the campaign targets
* **Max bid:** CPC or CPM of the campaign
#### Filtering by catalog
If your campaign targets multiple catalogs, use the **Catalog** dropdown to filter the report data to a specific catalog or view all catalogs combined.
#### Changing the date range
Use the **date filter** in the top-right corner to adjust the reporting period. The page will update to show metrics for your selected dates.
***
### Campaign actions
From the campaign header, you can take actions on your campaign:
1. Click **Edit Campaign** to modify the campaign settings
2. Click the **dropdown arrow** next to Edit for more options:
* **Duplicate** — create a copy of this campaign
* **Pause** / **Unpause** — temporarily stop or resume the campaign
* **Archive** — move the campaign to archived status
{% hint style="warning" %}
Archiving a campaign cannot be undone. Archived campaigns will no longer serve ads.
{% endhint %}
{% hint style="info" %}
If you are a retailer, you will only be able to edit FTA campaigns. For auction campaigns you can approve and reject as well from this page.
{% endhint %}
***
### Available tabs
Depending on your campaign type, you may see additional tabs below the header:
| Tab | When it appears |
| --------------- | -------------------------------------------------------------- |
| **Performance** | Always available — shows metrics and charts |
| **Keywords** | For campaigns with search targeting — view keyword performance |
| **Products** | For SPA campaigns — view individual product performance |
### Glance metrics
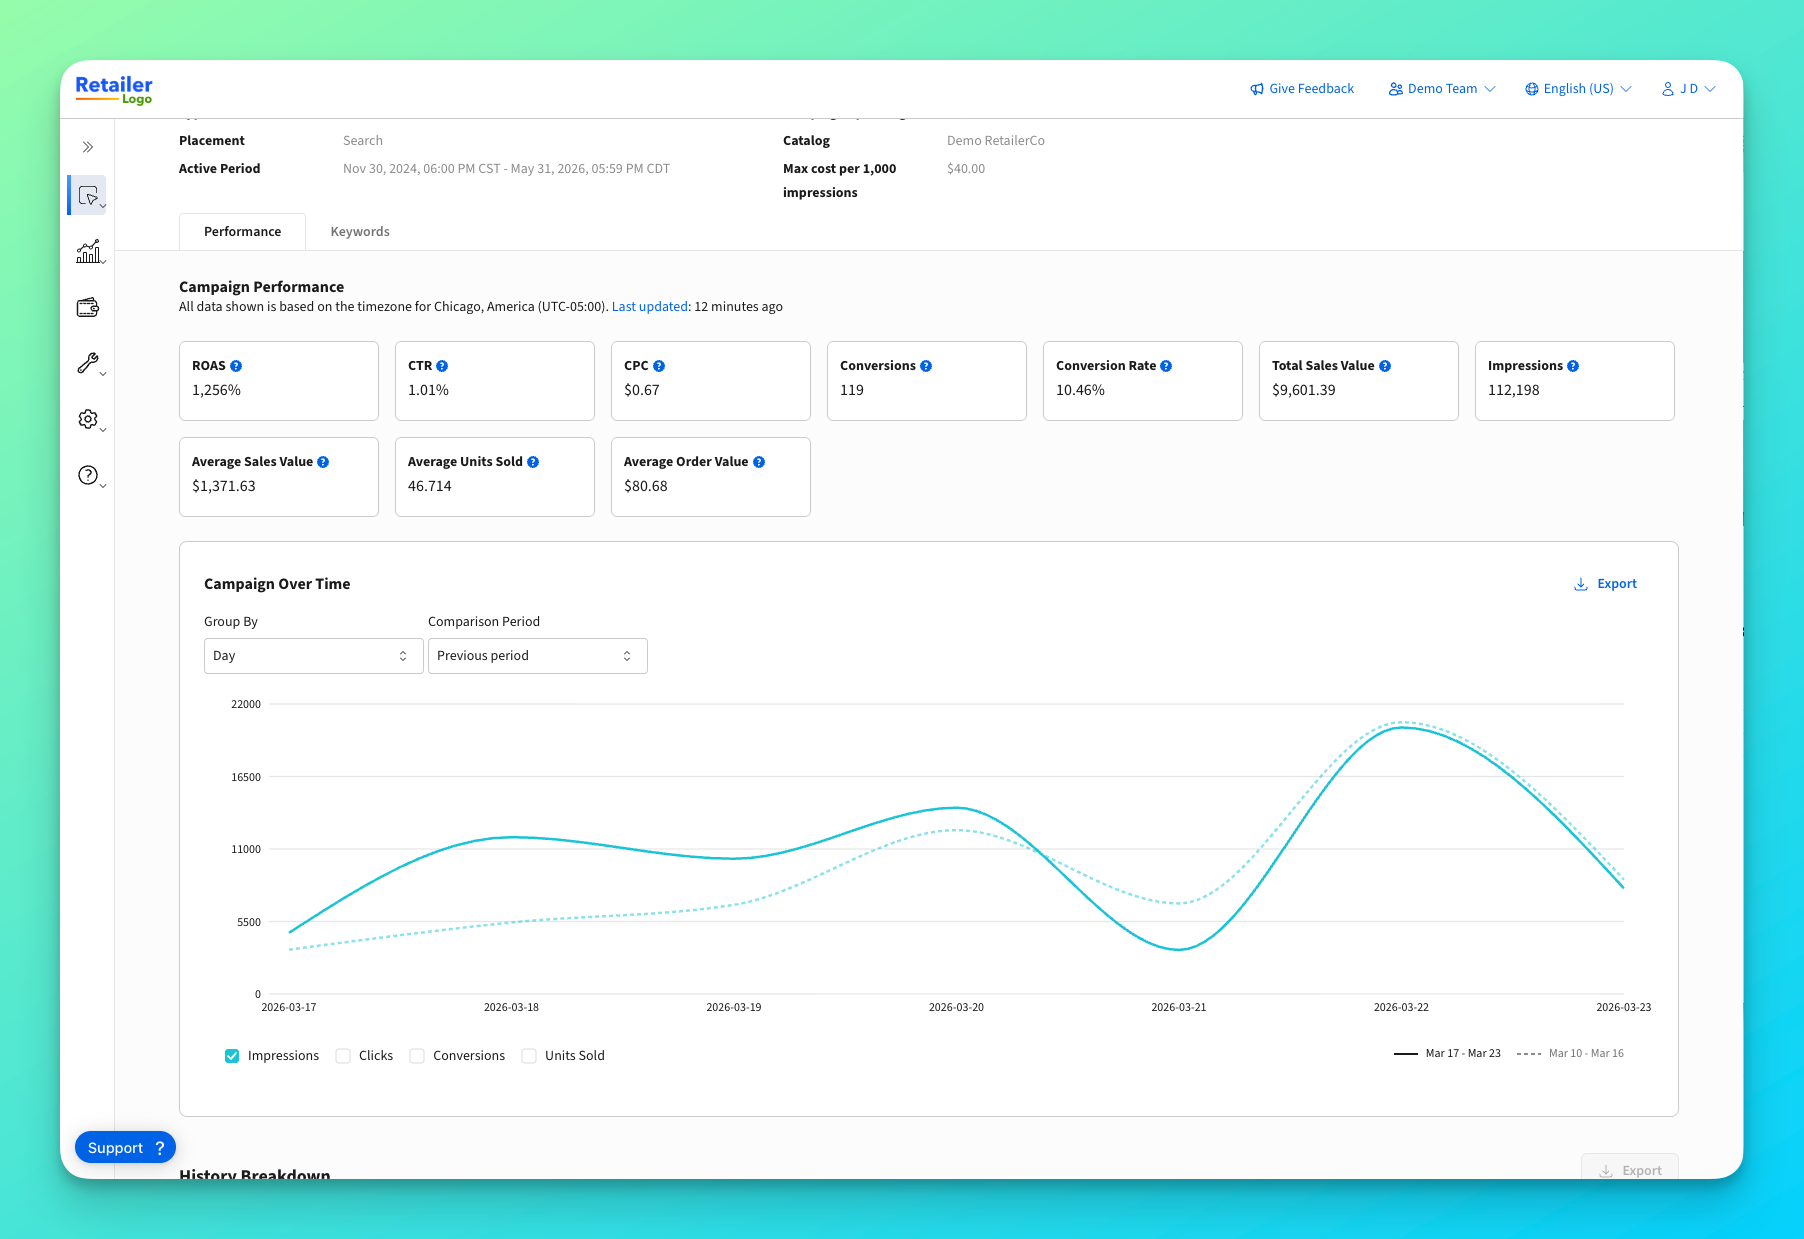
The glance metrics section shows summary cards with your campaign's key performance indicators for the selected date range.
| Metric | What it means |
| --------------------- | ---------------------------------------------------------------------- |
| **ROAS** | Return on Ad Spend — revenue generated per dollar spent |
| **CTR** | Click-Through Rate — percentage of impressions that resulted in clicks |
| **CPC** | Cost Per Click — average cost for each click |
| **Conversions** | Number of purchases attributed to the campaign |
| **Conversion Rate** | Percentage of clicks that resulted in a purchase |
| **Total Sales Value** | Total revenue from attributed purchases |
| **Impressions** | Number of times ads were displayed |
{% hint style="info" %}
Some metrics may show "N/A" if sales data is not enabled for your account. Contact your Epsilon representative if you need access to sales metrics.
{% endhint %}
***
### Performance chart
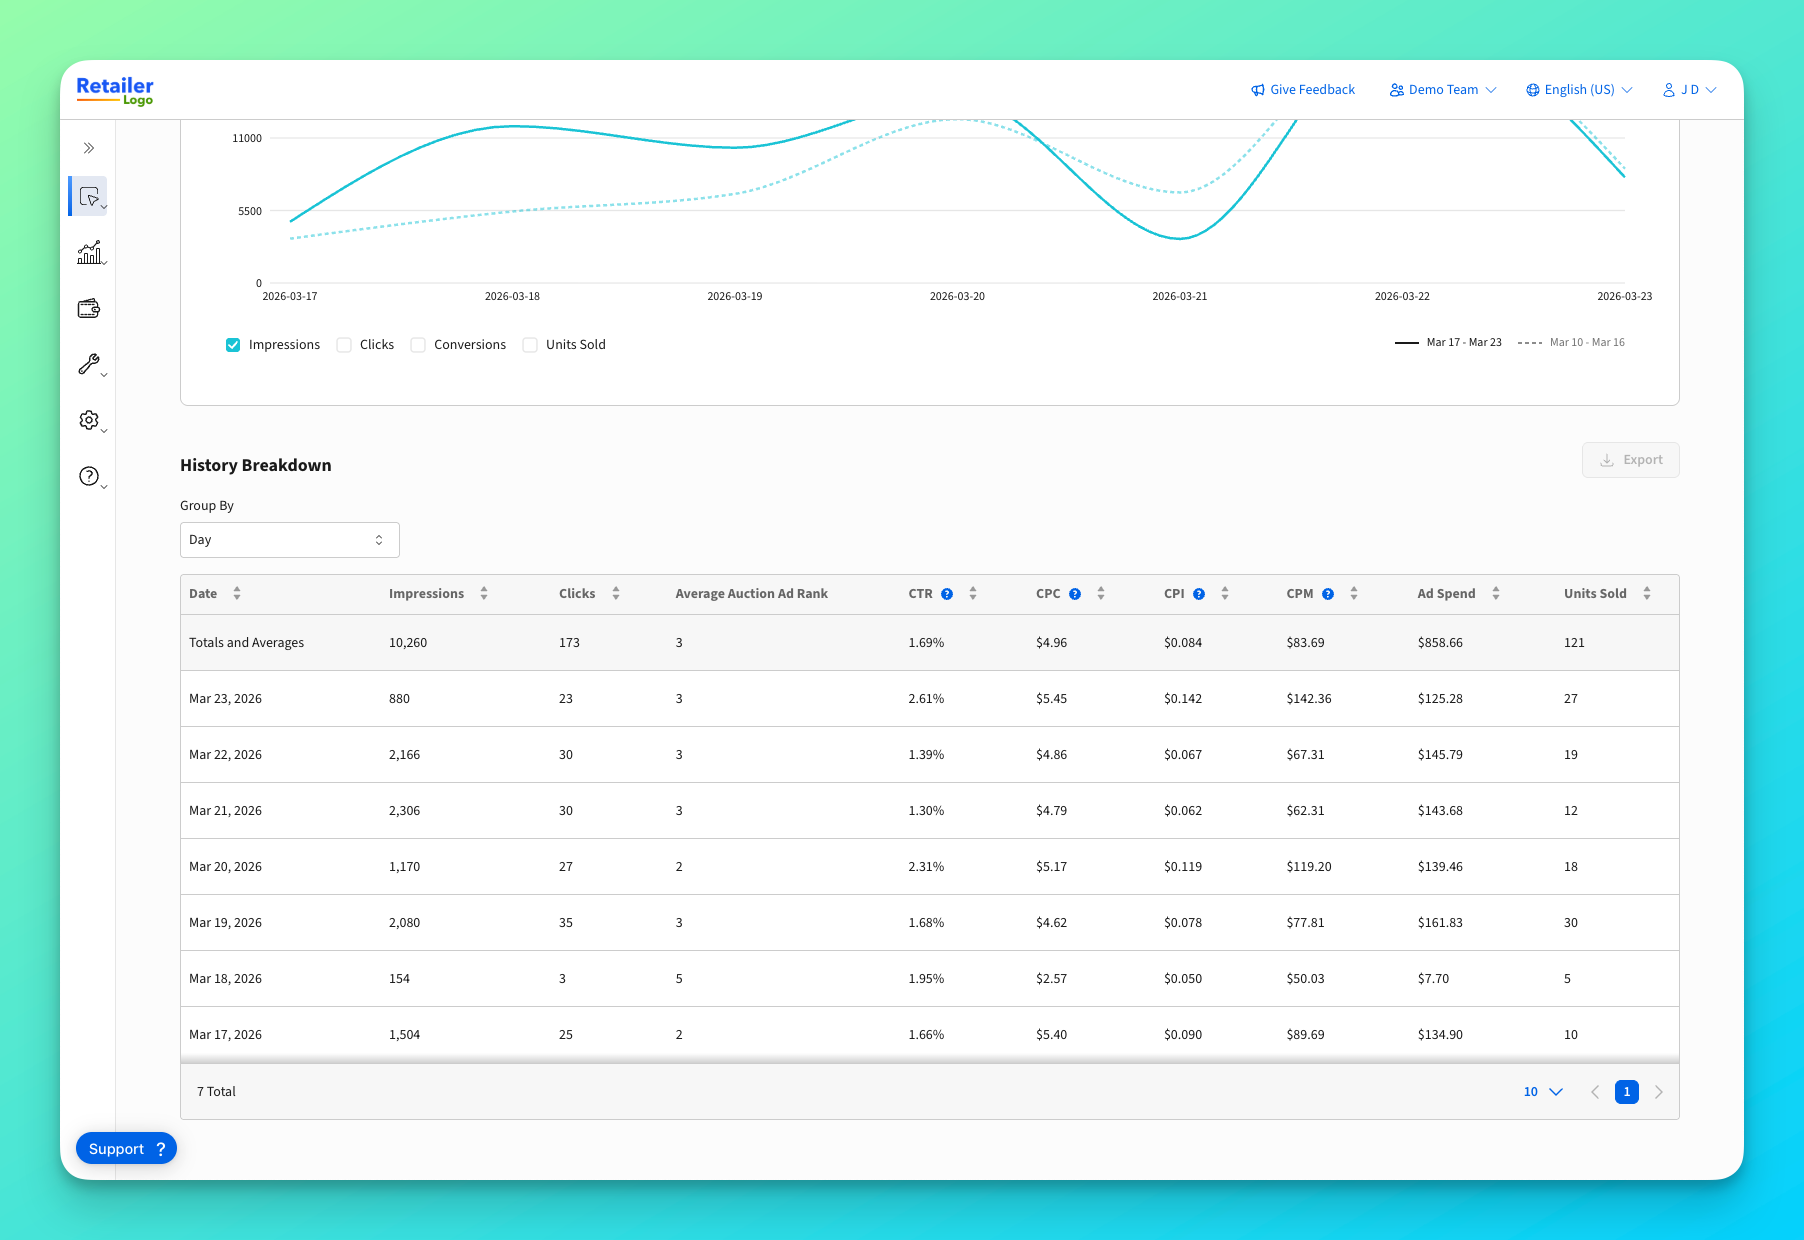
The **Campaign Over Time** chart shows how your campaign metrics have trended over the selected date range.
#### Reading the chart
* **Impressions** and **Clicks** are always displayed
* **Conversions** and **Units Sold** appear if sales metrics are enabled
* Click the metric names in the legend to show or hide individual lines
#### Adjusting the time grouping
Use the **Group By** dropdown to change how data is aggregated:
* **Hour** (available for date ranges of 7 days or less)
* **Day** (default view)
* **Week**
* **Month**
* **Quarter**
#### Comparing to previous periods
If available, use the **Comparison Period** dropdown to overlay data from a previous time period:
* **Previous Period:** compares to the same number of days immediately before
* **Previous Year:** compares to the same dates one year ago
Comparison data appears as dotted lines on the chart.
#### Exporting chart data
Click **Export** to download the chart data as a CSV file.
***
### History breakdown
The history breakdown table shows detailed performance metrics for each day (or period) in your selected date range.
#### Adjusting the grouping
Use the **Group By** dropdown to change how dates are grouped in the table. This works the same as the chart grouping.
#### Exporting the table
Click **Export** to download the full table data as a CSV file. The export includes all rows, not just the current page.
***
### Keyword breakdown
The Keywords tab provides a keyword-level report as well as a keyword match report.
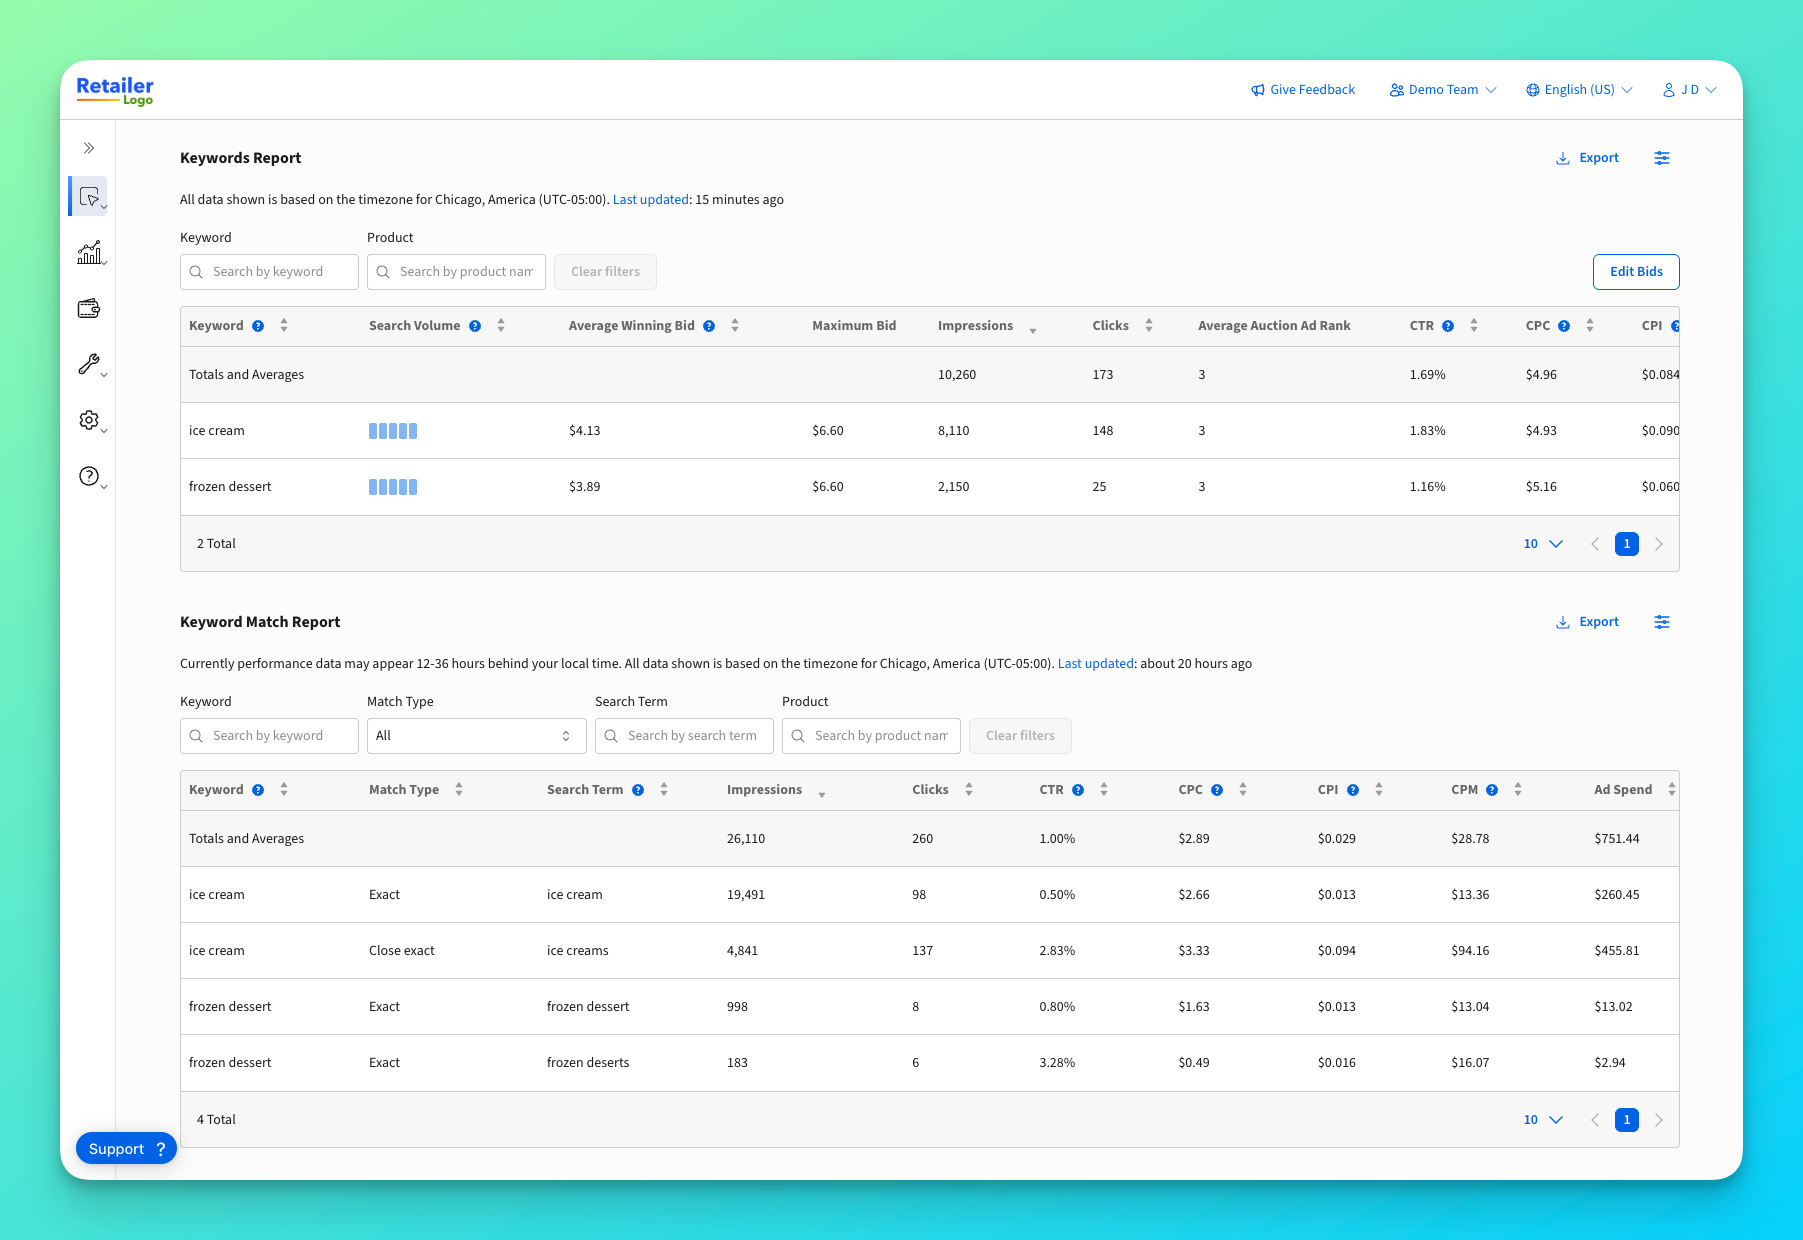
The **Keyword Report** provides top-level keyword performance, and the **Keyword Match Report** breaks down how your keywords have been matched to real customer searches.
#### Keyword Reporting
In the keyword-level report, you can filter down to a specific keyword, as well as filter to performance on a specific product.
Depending on the retailer, you can also view search volume and average winning bid for the previous 30 days.
#### Editing keyword bids
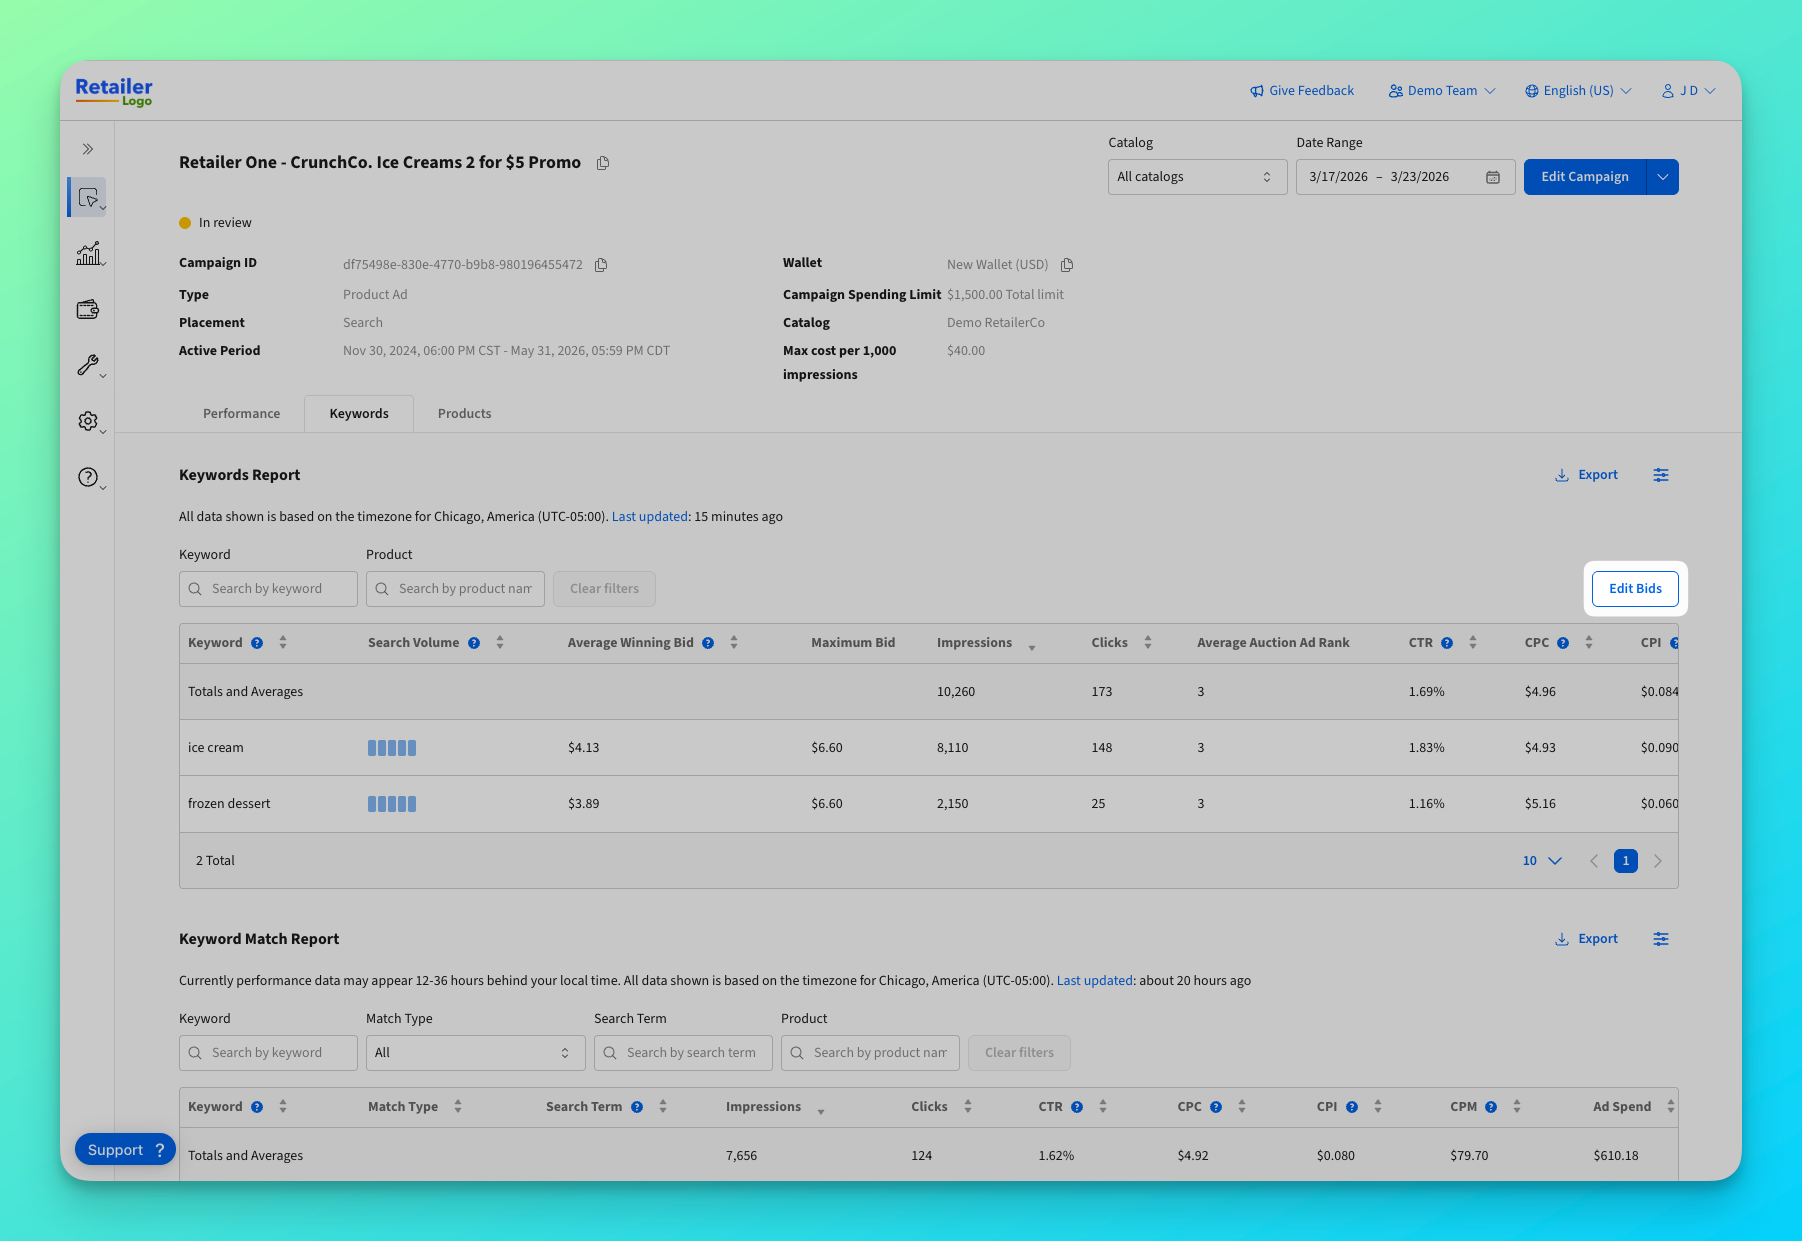
You can click **Edit Bids** in the top right of the keywords report to adjust your keyword-level bids using the information in the report.
#### Keyword Match Reporting
The keyword match report provides information on the performance of your campaign on exact customer searches, meaning you can see how your campaign is close-matching, as well as phrase match keyword performance. You can use this information to double-down, or remove certain keywords.
#### Exporting the tables
Click **Export** to download the full table data as a CSV file. The export includes all rows, not just the current page.
***
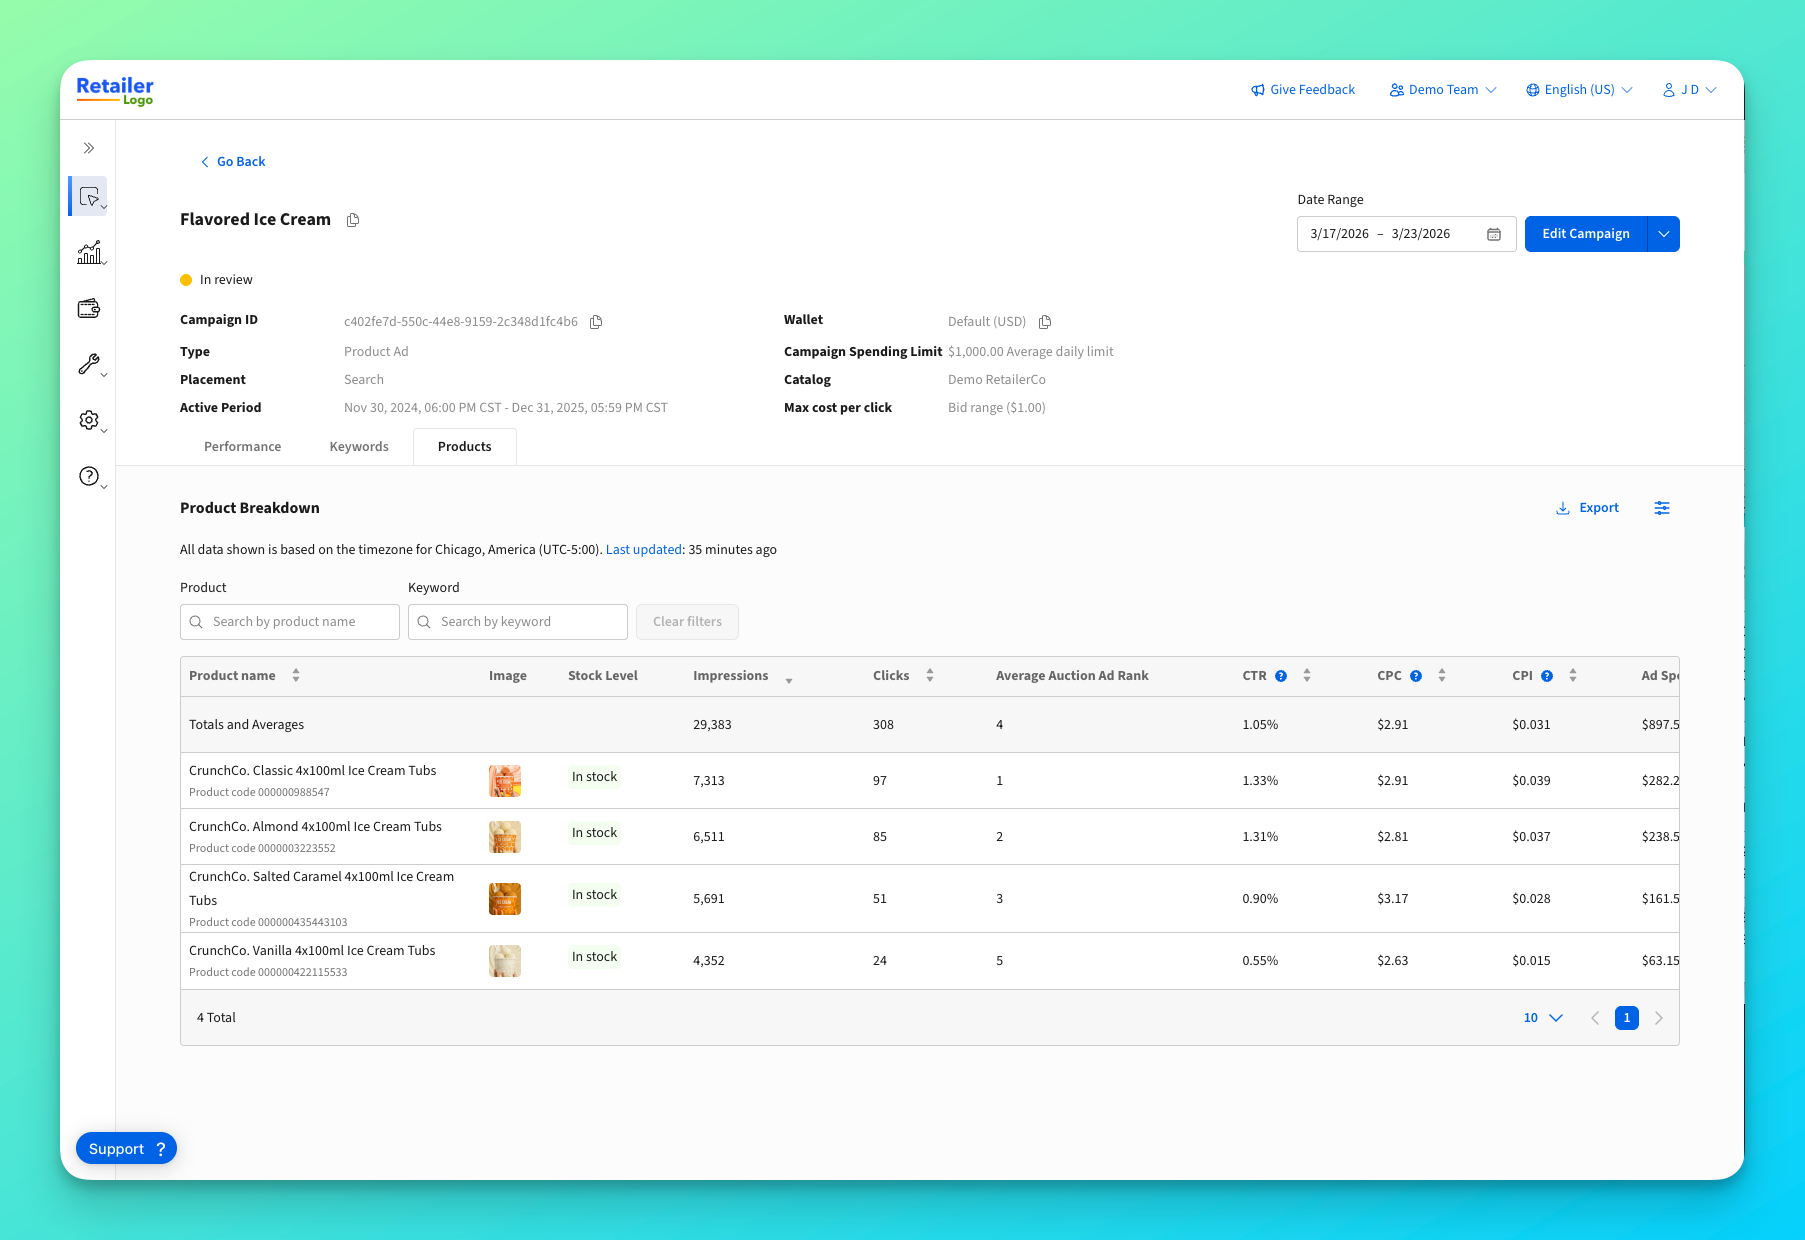
### Product breakdown
The Products tab helps you understand how each unique product is performing in your campaign. The data can be filtered to a specific product or keyword to better understand performance.
---
# Agent Instructions
This documentation is published with GitBook. GitBook is the documentation platform designed so that both humans and AI agents can read, navigate, and reason over technical content effectively. Learn more at gitbook.com.
## Querying This Documentation
If you need additional information that is not directly available in this page, you can query the documentation dynamically by asking a question.
Perform an HTTP GET request on the current page URL with the `ask` query parameter, and the optional `goal` query parameter:
```
GET https://help.citrusad.com/retail-media-interface/advertiser-reporting/campaign-level-reporting.md?ask=&goal=
```
`ask` is the immediate question: it should be specific, self-contained, and written in natural language.
`goal` is optional and describes the broader end goal you are ultimately trying to accomplish on behalf of the user. GitBook uses it to tailor the answer towards what is most useful for that goal.
The response will contain a direct answer to the question and relevant excerpts and sources from the documentation.
Use this mechanism when the answer is not explicitly present in the current page, you need clarification or additional context, or you want to retrieve related documentation sections.